What is Iperf?
So you just got a new router and you want to know whether it’s actually faster than your old router or you just got a new wireless card and you want to know how much faster the new wireless card is over the old one. How do you test the performance?
The answer is Iperf. Iperf is a free multi-platform network performance testing application that works on a variety of platforms including Windows, Mac, Linux, Android and iOS. The way Iperf works is you would connect two systems on a network where one system acts as a client and one acts as a server. Using the client system, the user can initiate a TCP or UDP datastream to the server and the performance will be recorded.
Iperf Installation
As Iperf runs as a standalone app, it doesn’t need to be installed for most platforms. Today, we’ll be using Windows, but aside from the syntax needed to launch the application, it should operate the same exact way. The first step to using Iperf is to download the app which can be found on the Iperf website here.

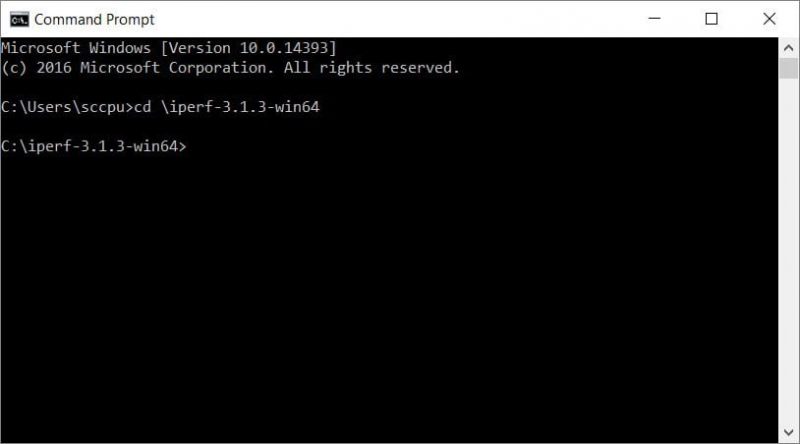
Once Iperf is downloaded, extract the contents of the folder to the Windows root directory (typically C:). Then, open up the Command Prompt (CMD) and navigate your way to the Iperf directory. Since I put the directory in my root directory, navigating there is done simply by typing in “cd \iperf-3.1.3-win64”. This first step is the same on both the server and client systems.
Using Iperf
In order to benchmark network performance using Iperf, you’ll need two systems – one to serve as a server and one to serve as a client. Iperf is able to test using both TCP (Transmission Control Protocol) and UDP (User Datagram Protocol).
Server

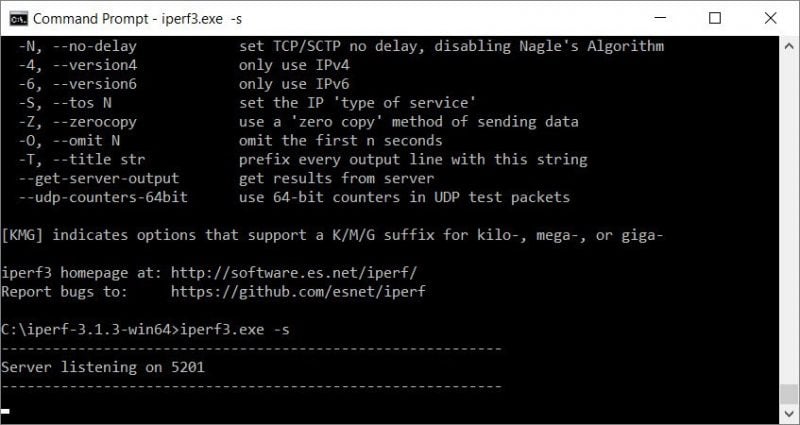
To start Iperf in server mode, simply type in “iperf3.exe -s”. Iperf will automatically start and tell you which port the server is listening to.
Client TCP Performance
The TCP performance test will mainly help you determine the maximum speed of your connection.

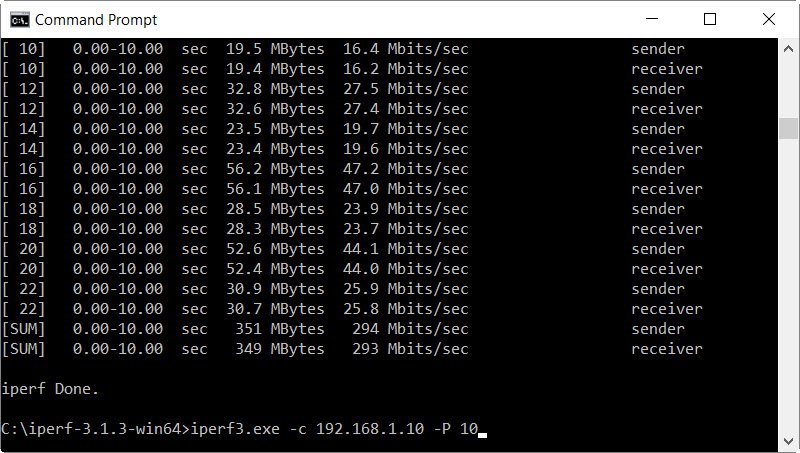
Once the server has Iperf started in server mode, simply type in “iperf3.exe -c [IP address of server]”. In my case, this would be “iperf3.exe -c 192.168.1.10”. However, many times to reach the maximum performance the network is capable of, you’ll need to run multiple client streams simultaneously which is why I also tacked on -P [number of threads]. In the example above, I used “iperf3.exe -c 192.168.1.10 -P 10”. This will run 10 client streams simultaneously to ensure the maximum performance possible is reached.
Once the test is complete, it will tell you how much data was transferred and what the average speed is. In this case, 294Mbps.
Client UDP Performance
The UDP performance test will mainly help you determine the quality of your connection.

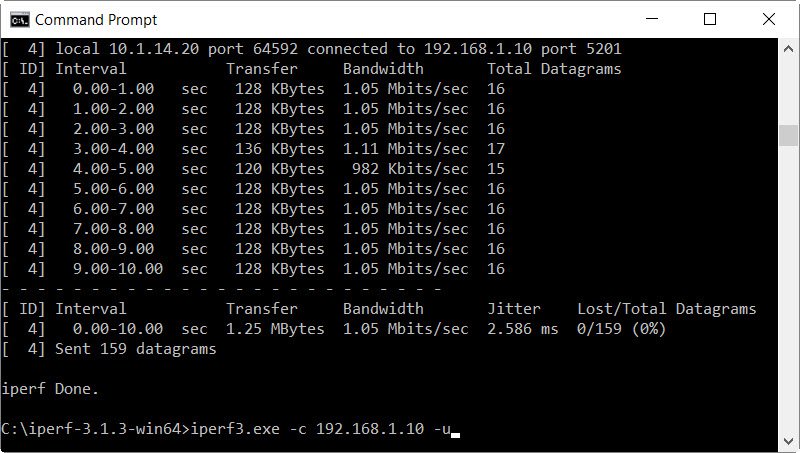
In order to test UDP performance, simply enter “iperf3.exe -c [IP address of server] -u”. At the end of the test, Iperf will tell you the amount of jitter as well as the amount of dropped packets in the transmission. High jitter and lots of dropped packets will result in issues in VoIP calls, online gaming, etc.
Additional Iperf Commands
For those who want to do some more advanced network testing, Iperf also has a ton more functionality which can be enabled using option flags below. The total list of option flags can also be displayed by typing using the -h flag. In the example above, this would be done using the following command “iperf3.exe -h”.
Usage: iperf [-s|-c host] [options] iperf [-h|–help] [-v|–version]
Server or Client:
-p, –port # server port to listen on/connect to
-f, –format [kmgKMG] format to report: Kbits, Mbits, KBytes, MBytes
-i, –interval # seconds between periodic bandwidth reports
-F, –file name xmit/recv the specified file
-B, –bind <host> bind to a specific interface
-V, –verbose more detailed output
-J, –json output in JSON format
–logfile f send output to a log file
-d, –debug emit debugging output
-v, –version show version information and quit
-h, –help show this message and quit
Server specific:
-s, –server run in server mode
-D, –daemon run the server as a daemon
-I, –pidfile file write PID file
-1, –one-off handle one client connection then exit
Client specific:
-c, –client <host> run in client mode, connecting to <host>
-u, –udp use UDP rather than TCP
-b, –bandwidth #[KMG][/#] target bandwidth in bits/sec (0 for unlimited)
(default 1 Mbit/sec for UDP, unlimited for TCP)
(optional slash and packet count for burst mode)
-t, –time # time in seconds to transmit for (default 10 secs)
-n, –bytes #[KMG] number of bytes to transmit (instead of -t)
-k, –blockcount #[KMG] number of blocks (packets) to transmit (instead of -t or -n)
-l, –len #[KMG] length of buffer to read or write
(default 128 KB for TCP, 8 KB for UDP)
–cport <port> bind to a specific client port (TCP and UDP, default: ephemeral port)
-P, –parallel # number of parallel client streams to run
-R, –reverse run in reverse mode (server sends, client receives)
-w, –window #[KMG] set window size / socket buffer size
-M, –set-mss # set TCP/SCTP maximum segment size (MTU – 40 bytes)
-N, –no-delay set TCP/SCTP no delay, disabling Nagle’s Algorithm
-4, –version4 only use IPv4
-6, –version6 only use IPv6
-S, –tos N set the IP ‘type of service’
-Z, –zerocopy use a ‘zero copy’ method of sending data
-O, –omit N omit the first n seconds
-T, –title str prefix every output line with this string
–get-server-output get results from server
–udp-counters-64bit use 64-bit counters in UDP test packets

0 Comments